


[eBook] The PFAS Handbook: The Ultimate Guide to Identifying & Mitigating PFAS Risks in Your Supply Chain – Download Now
Clear Visibility
Into Supply Chain Risk
Empowering global manufacturers with solutions for
Helping Complex Manufacturers Lead the Way
in Supply Chain Sustainability Management
Join a community committed to setting new standards in compliance and ESG.


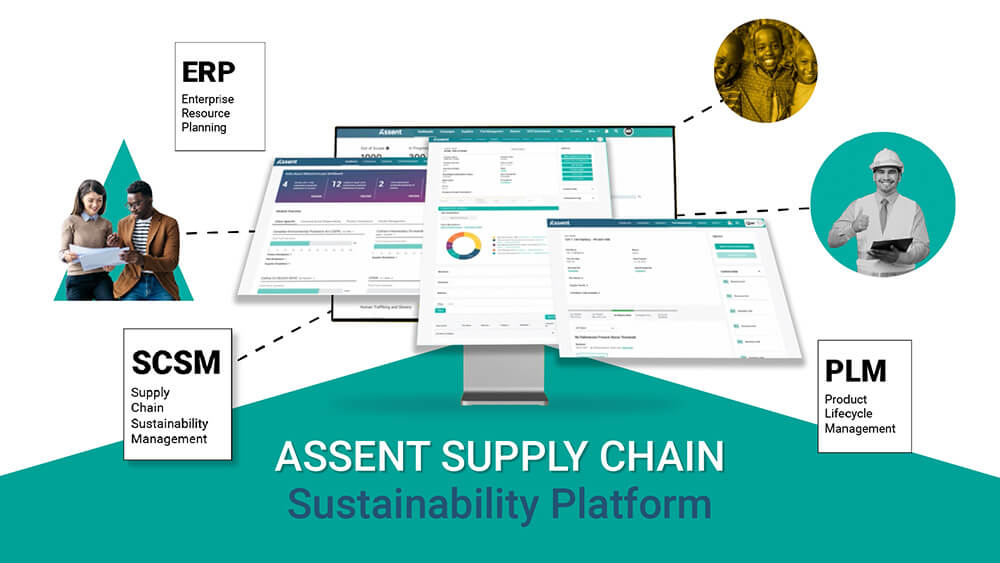
Your Partner in Supply
Chain Data Management
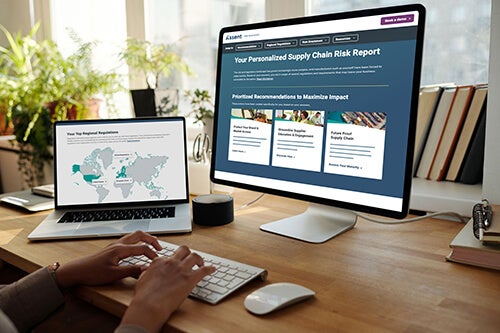
The Assent Supply Chain Sustainability Platform helps you address supply chain risks throughout your global supply chain. Protect your business from revenue risks with access to deep expertise, data management software, and services.
Discover Our Featured Solutions & Highlights


304% ROI Over Three Years
According to a commissioned Forrester Consulting Total Economic Impact™ Study, manufacturers that invested in the Assent platform experienced 304% ROI over three years through improved supplier engagement and reduced non-compliance costs.
Download the Study“Assent is probably saving us millions of dollars in fines alone, ignoring any other legal implications of compliance violations.”
— Head of supplier regulatory compliance, home appliances.
Industry Solutions for Complex Manufacturing


One Platform, Endless Opportunities: Leading Compliance & Sustainability Innovation for Complex Manufacturers
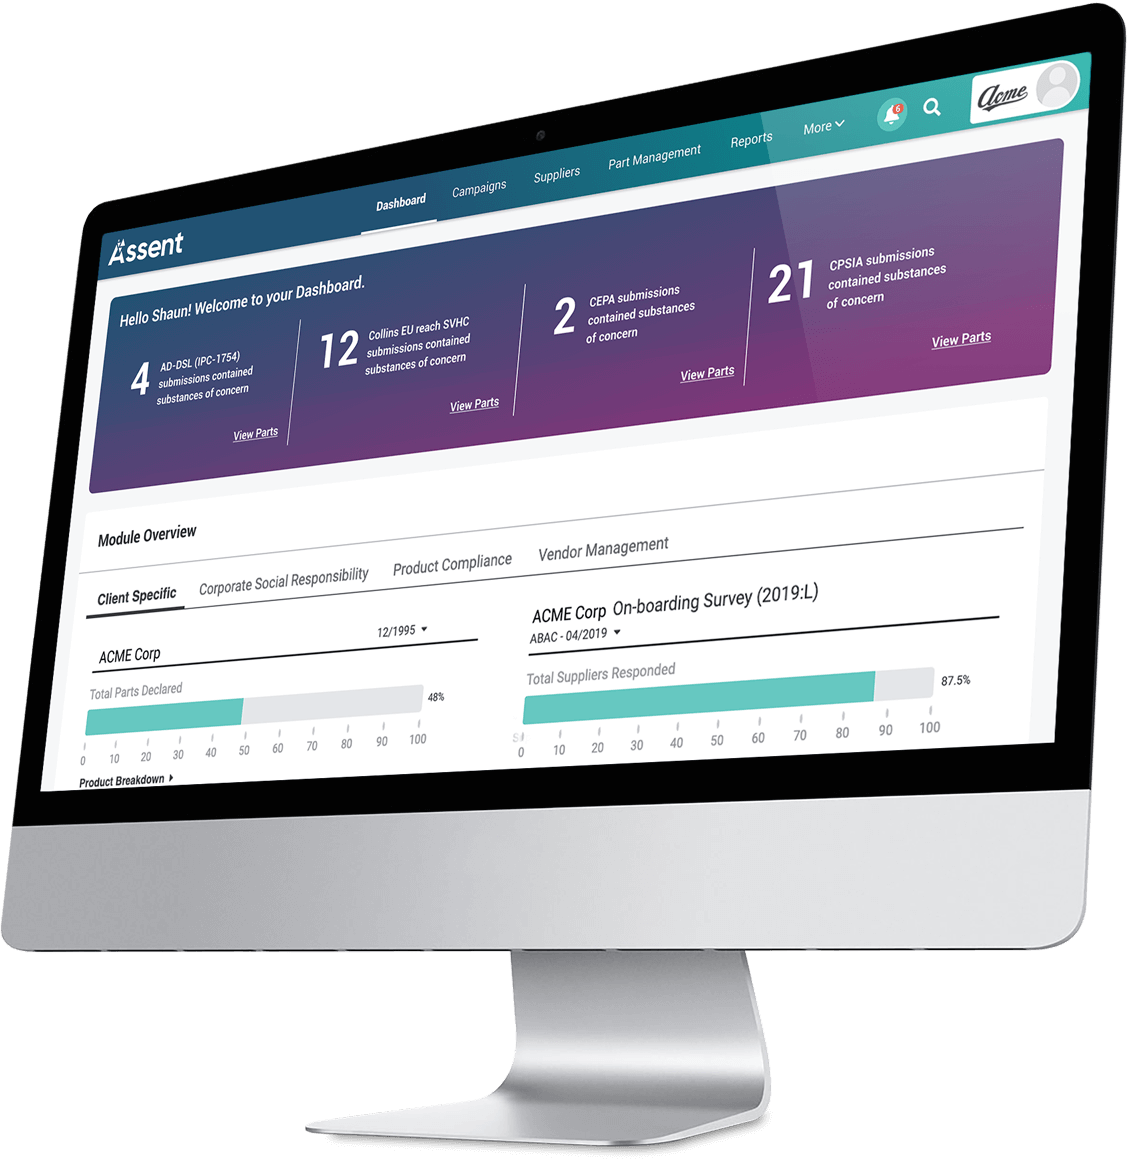
When it comes to engaging your supply chain, Assent is your dedicated partner, gathering, centralizing, and delivering the data you need to drive actionable insights for your organization.
What We Offer:
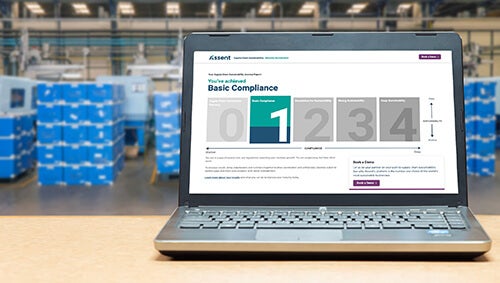
- Deep Data Visualization: Navigate supply chain risks with confidence, thanks to accessible dashboards that spotlight essential data
- Simplify Data Collection: Benefit from our proven data collection methods, designed to enhance data quality and create efficiencies
- Streamlined Communications: Our easy-to-use platform ensures seamless customer and supplier engagements
- Growth-Ready Scalability: As your business expands, our platform meets your evolving needs by proactively adapting to new requirements
With Assent, you’re not just meeting current requirements. You’re proactively managing supply chain risks to create a strategic advantage.

Beyond Leading Technology: Manage Compliance With Confidence
Work with our seasoned experts, leaders in shaping compliance and ESG initiatives. With us, you gain:
- An Influential Voice in Industry Groups: Actively shaping future regulations, our team ensures your business stays informed and prepared.
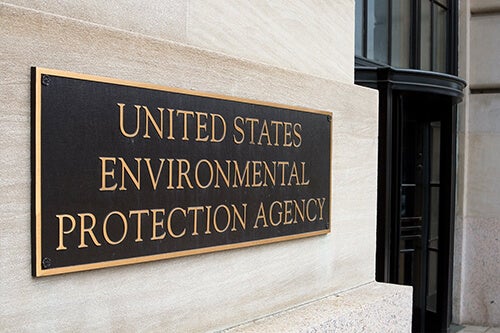
- Regulatory Knowledge: We continuously monitor global regulations to keep your operations ahead of the curve.
- Deep Program Expertise: Our experience in complex manufacturing and regulatory environments translates into effective strategies for your business.